
Economic Times and Technology Continue to Impact the Real Estate Market
Frank D'Angelo
Economic times are shifting, technology continues to evolve and the real estate market has become one of the most popular topics of discussion for most people. The bubble talk is beginning to surface once again. Many economic sectors are beginning to discuss the increased values in the real estate market and are utilizing a limited perspective of increasing mortgage interest rates to determine their opinions. Moreover, many are referencing the same 2 elements with the most recent recession an hinting at a repeat of what happened a little over 10 years ago. That limited approach to the actual real estate market is completely wrong method of forecasting. Anyone thinking they should wait for prices to drop before considering buying their first home or additional investment properties will be at a loss going forward. See why below!
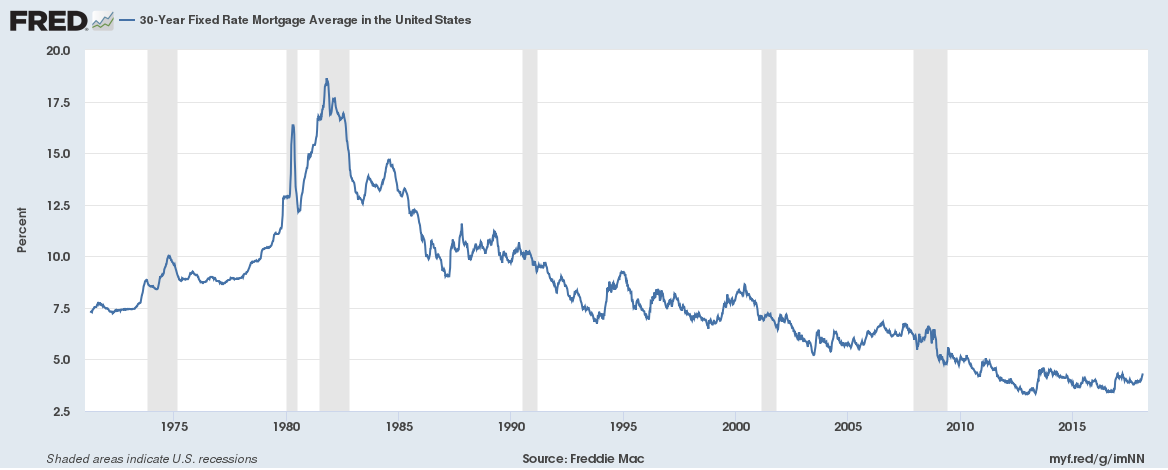
The illustration below clearly illustrates record low interest rates when looking at the 30 year history as reported by Freddie Mac courtesy of FRED (the Federal Reserve Economic Data of St. Louis). Note the shaded areas of this 30 year illustration indicates a recorded recession.
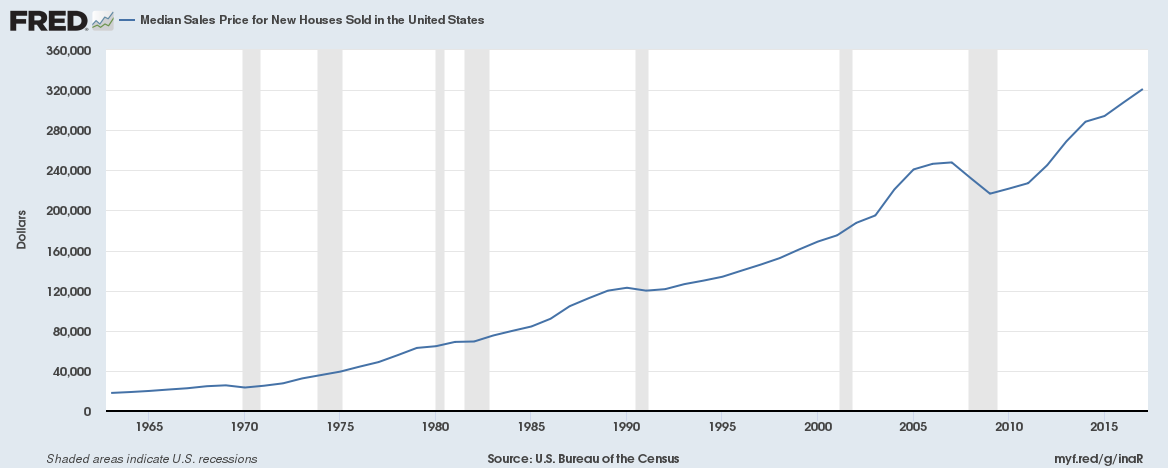
Looking back at median home prices since 1964, there was only one noticeable anomaly associated with over-inflated home prices. Clearly that anomaly took place just before the most recent recession. Aside from this recent anomaly, the median home prices have increased at about 4-5% annually. Current home prices fall well within that normal trend. See illustration below.
Both nationally and locally, the real estate market appears to be approaching normalcy. The US economy is strong, unemployment is low, buyer demand is extremely high and growing and the housing supply is at record low. Also, new construction cannot keep up with the demand.
Additional factors that support modest 3-5% growth in home prices for the next few years:
- Existing Home Inventory Supply is less than 3 months regionally. The magic number historically is 6 months. Typically anything less than 6 months supply supports a growing sellers market and anything above 6 months supply supports a declining buyers market.
- Housing supply nationally is the same as it was in 1994; however our nation has 63 million more people.
- The average number of single family home starts according to the National Association of Realtors 50 year average is 1.2 million; yet we're only at 950,000. New Construction has a ways to go to accommodate the housing needs and demands.
- The gap between housing demand and supply has never been wider.
- The GDP has soared to a record $18.57 Trillion USD. That is one of the best measures of the US economy.
- The mortgage interest forecast calls for slight increases, yet look at the illustration above to keep it all in perspective historically. By no means is any economist calling for double digit interest rates with the nations growing economic strength.
- Rent rates continue to soar to new highs quarterly during this sellers market.
In summary all indicators are supporting a continued growth/sellers market going forward with inventory levels growing slightly over the next few years. Home prices will likely not achieve another year of double digit growth and will likely remain at the historical 3-5% annual growth norm until another significant economic event occurs. For both 1st time home buyer and investors looking to buy more real estate; the sooner they get in the market, the better. Consider this; whether renting or buying, someone is buying down the mortgage. Finally, the gap between renting and buying has never supported the home affordability index to own a home like it does today.
Whether you're a potential home buyer, seller or investor; start with a hassle free experience real estate consultation. It's FREE!
Start by connecting with us right here...
Find Your Current Home Value Here